This is a dark theme Heatmap / Bookmap style chart, featuring the following indicators and settings:
Volume dots for big buy/sell executions relative to size (can easily adjust threshold for more/less bubbles)
Visual representation of resting liquidity
- Black/Greys: low liquidity
- Whites: medium-low liquidity
- Yellow: medium liquidity
- Orange/Red: high liquidity
Limit Buy/Sell DOM order quantities on right edge
Session Volume Profile on Right Edge with Value Area Highlighted
Session Delta Volume Profile on Right Edge
Current best Bid/Ask lines
This chart is set for 10 second line chart in the current ES futures contract, but it can easily be changed to any instrument and timeframe/data periods you may want.
The highlight colors and the parameters for the depth of market can be adjusted under the studies settings if you want different color highlight combinations under the study settings or to change the comparison method (Values vs %)
You can adjust the amount of area left on the right edge of the chart by default using the “Lock Fill Space” function under Chart Settings.

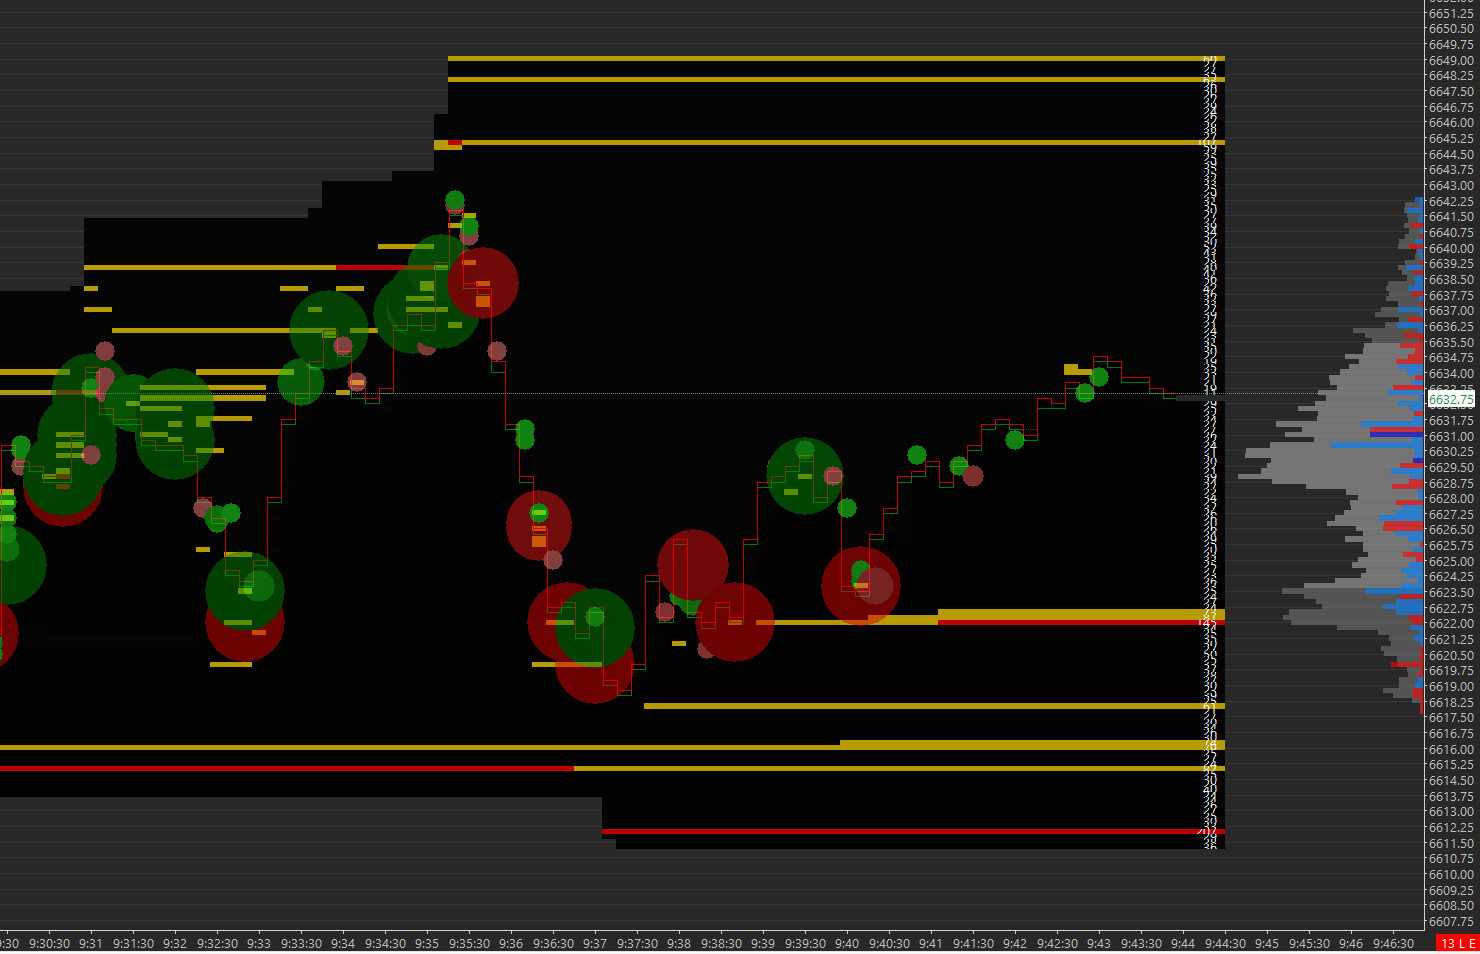 Image 1 of 6
 Image 2 of 6
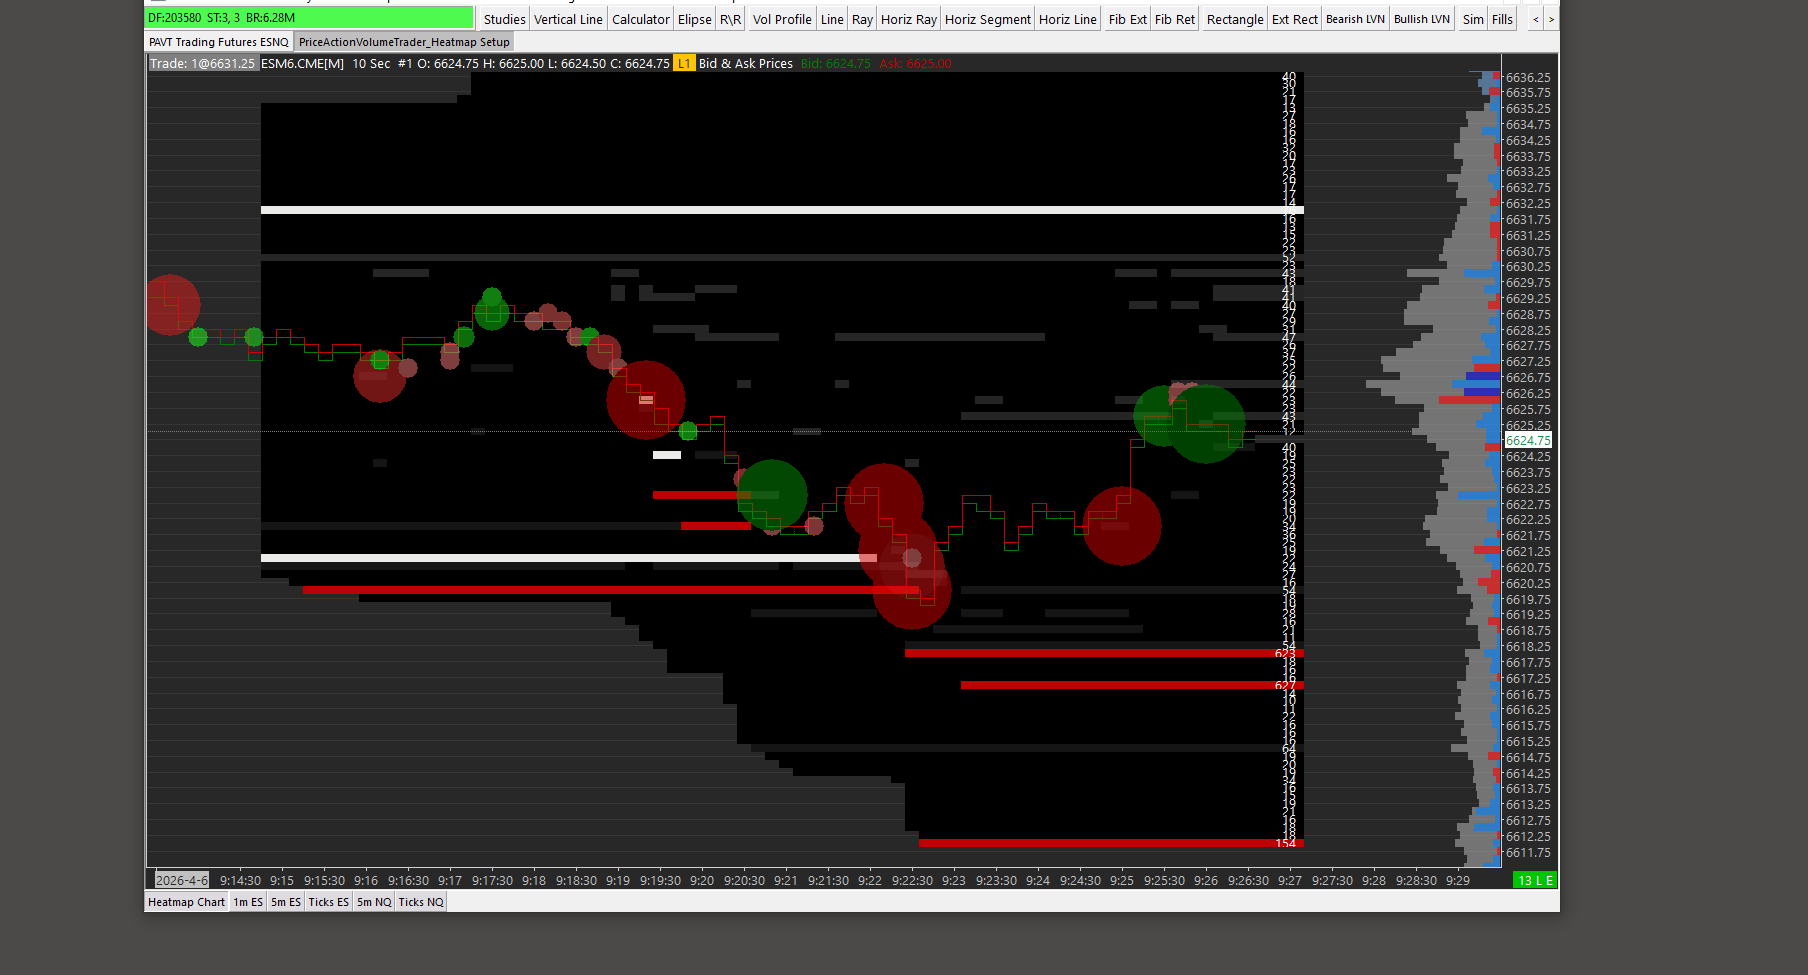 Image 3 of 6
 Image 4 of 6
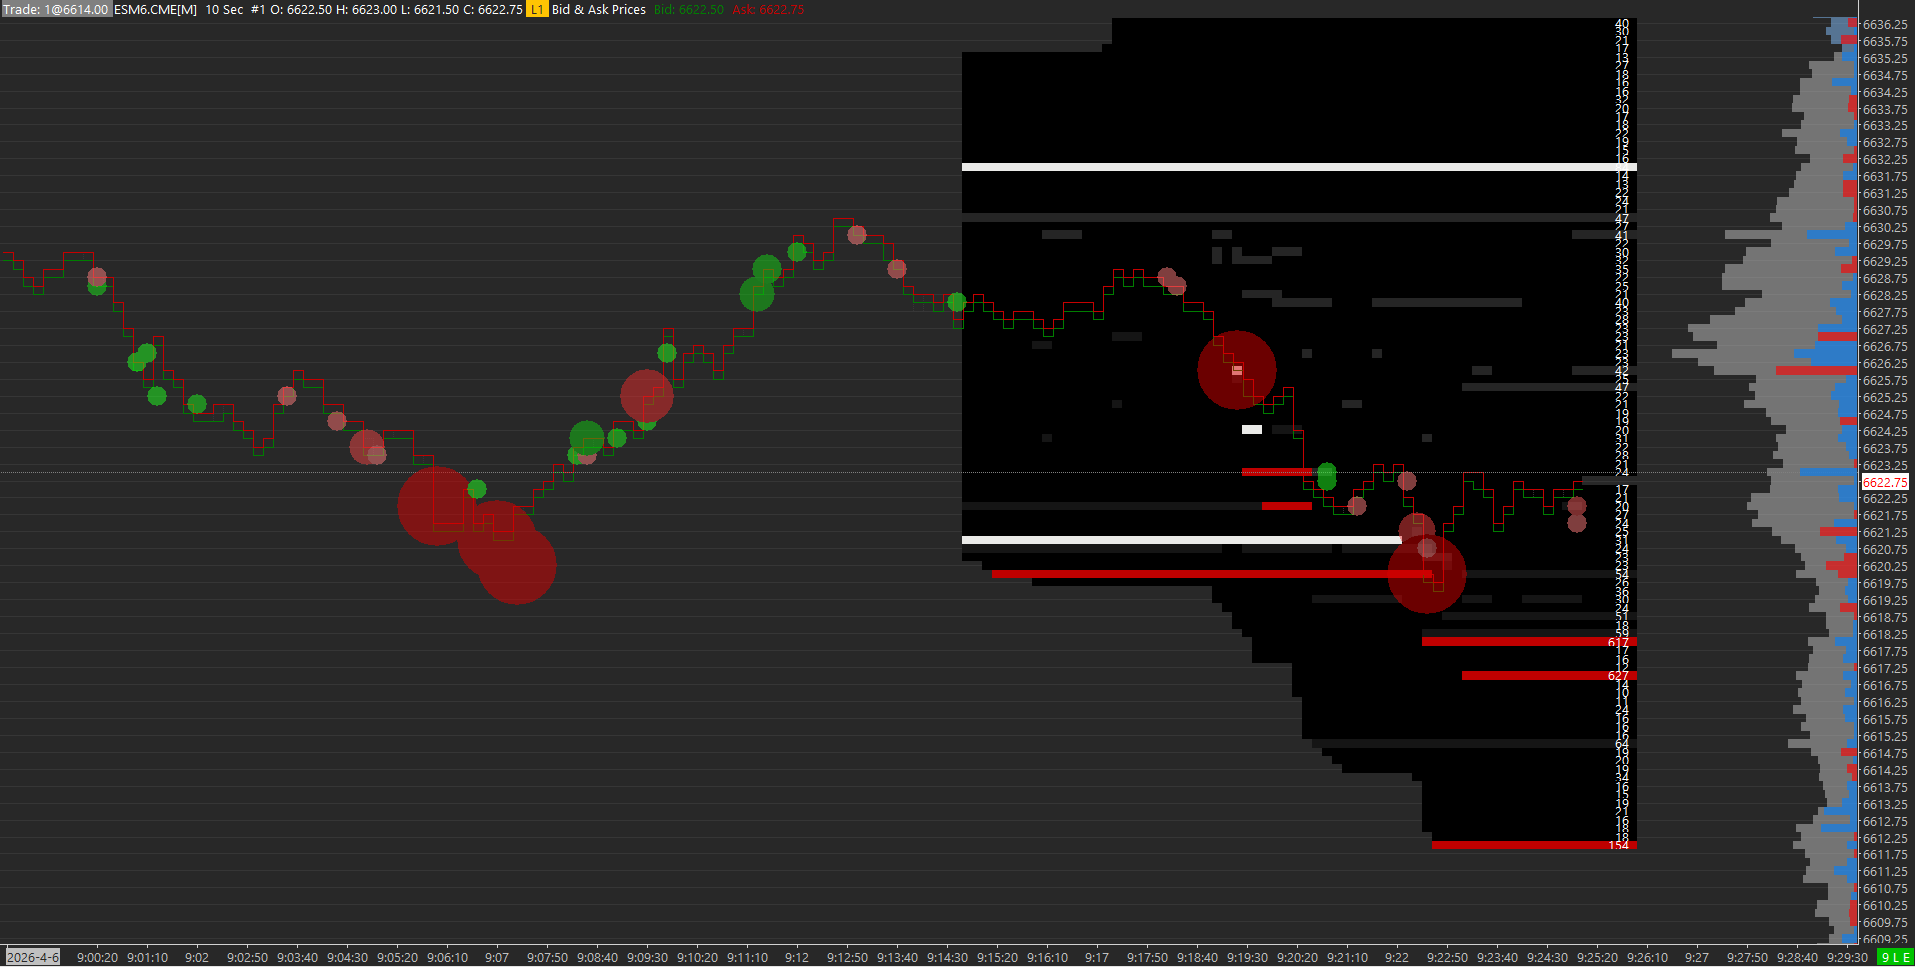 Image 5 of 6
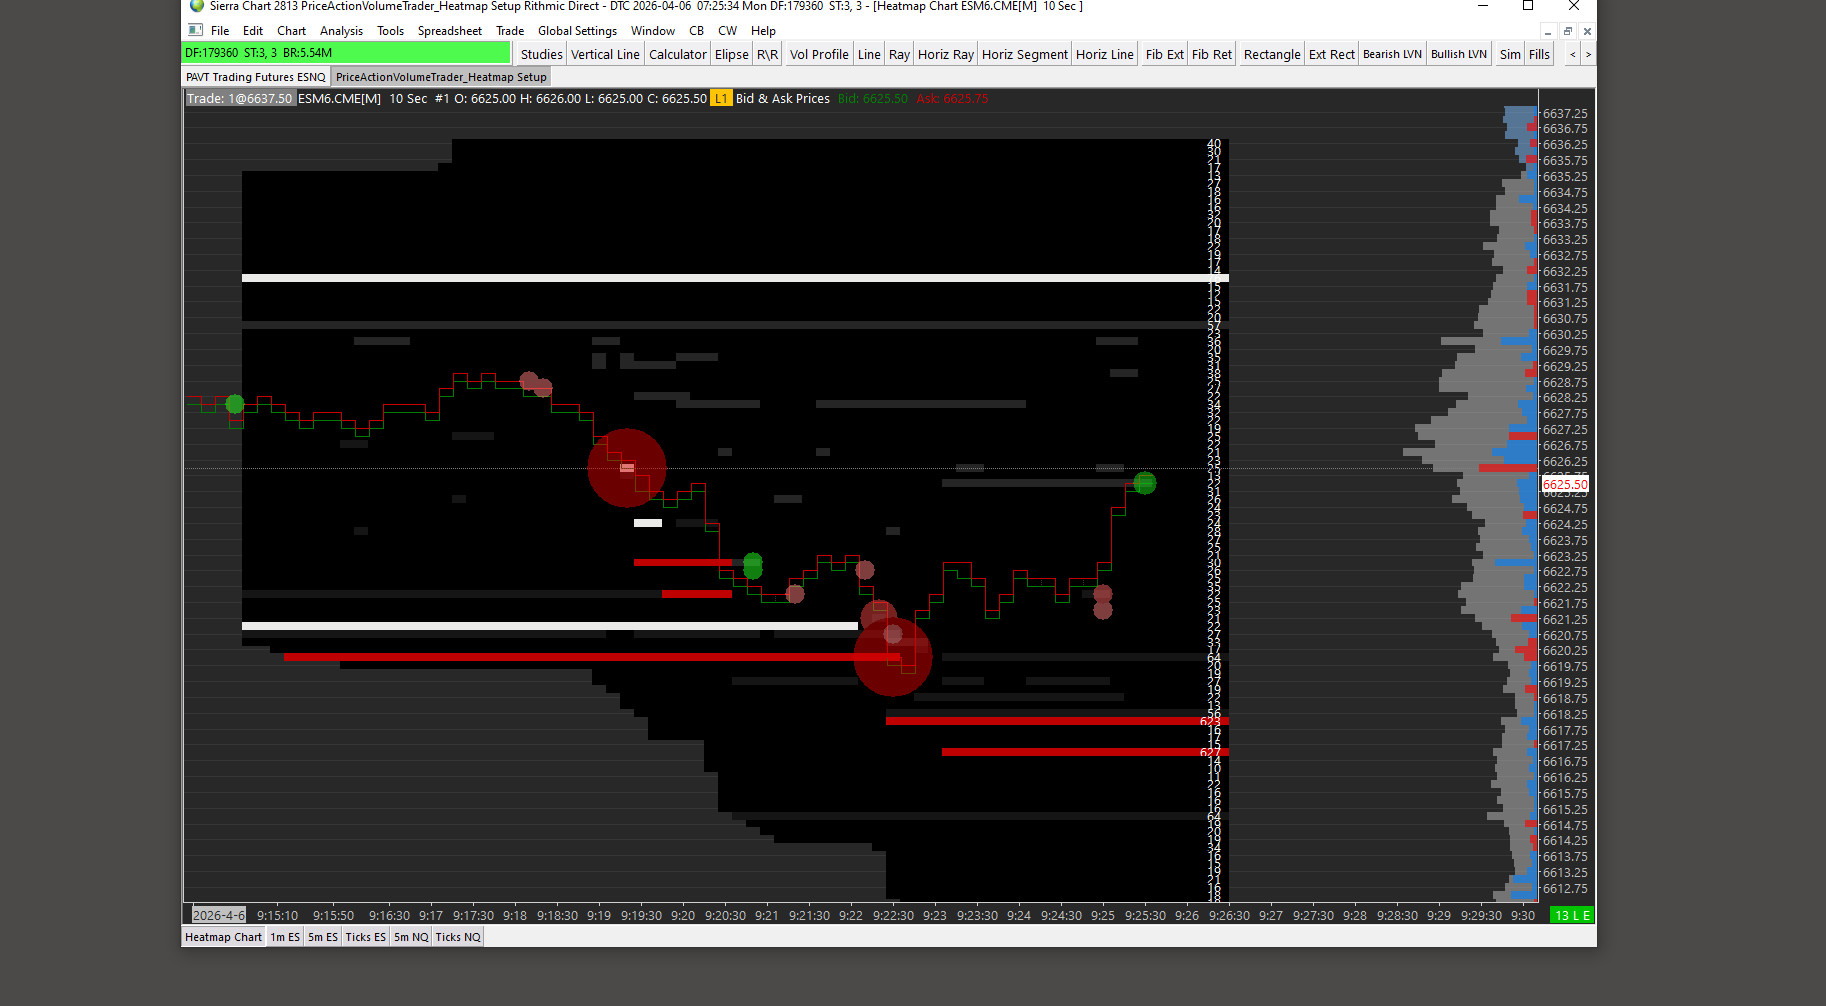 Image 6 of 6