
Custom Sierra Chart Templates

Sierra Chart is one of the best trading platforms available to traders while being affordable. It is natively made for Windows, but can be run on a Mac/Linux with software’s such as WINE or Parallels. It gives traders highly customizable charts that can be adapted to any style traders and markets.
It does however come with a high learning curve as it takes hundreds of hours of use and study to learn all the nuances of creating the best charts for your analysis and trading. That is why I am offering many custom charts I have made over the years so you can just install them on your system and start using them right away. All these templates are completely customizable and can be changed to any instrument or periods you want. The chart offerings are constantly being updated with new ones as they are developed.
I have a whole YouTube playlist with in depth tutorials on many different Sierra Chart functions which you can check out HERE.
*** We just rolled over into the June 2025 CME futures contracts for equity indexes such as NQ (Nasdaq) and ES (SP500). When you download and install your template, make sure to update the symbols to the current contracts to have the charts reload and display properly. There are instructions at the bottom of this page for installation and troubleshooting. ***
Sierra Chartbook Store


Installation:
1- After you order you will receive an email with a 24 hour link to download the .cht file
2- Install the file into your C:/SierraChart/Data folder
3- Launch Sierra Chart, go to File, Open Chartbook, and look for the .cht file in the Data folder to open it
Customization:
To change the graphics, fonts and colors go to Chart Menu, Graphic Settings - Chart. Make sure the “Use global graphic settings” option is off, unless you want to use your own systems default graphic settings.
To switch instruments go to Chart Menu, Chart Settings, Symbol
To have a smooth running chart with no gaps between contract expirations, I always have this set under Chart => Chart Settings => Symbol => Continuous Contract => Continuous Futures Contract - Volume Based Rollover, Back Adjusted.
Troubleshooting:
When you open a chart it might not load properly or give an error for example if you are loading a futures symbol that already expired. In order to reload the chart there are several options you can do:
First go to Chart Menu, Chart Settings, Symbol and look up the current contract (for example the current front ES contract on the CME for the SP500), click apply and let the chart reload.
You can also go to the Edit menu and click “Translate Symbols to Current Service” and that will make the chart reload. This is especially useful if you made any changes in your broker connection or data feed.
You can also go to Edit menu and click “Delete all Data and Download” to have the chart reload.
To learn more check out all my Sierra Chart tutorials on my YouTube channel HERE.
Packages:
Many people ask what package they need to activate in order to use the templates. The choice will depend on whether you want to have market depth data for studies such as footprint and if you want to be able to have live CME data as well and not delayed data. If you are only using it to practice and back test, then you might not need live data. But if you need live data for your own futures account or for a funding company, then you’ll definitely need an advanced package. All Integrated packages come with Sierra Chart’s own Denali data feed which is a requirement to connect to live CME data and for using Rithmic funding accounts (Apex, TopStep, TradeDay, etc).
Here is the breakdown of the packages and what each offers:
Base Package 3: delayed CME data, basic volume profile studies
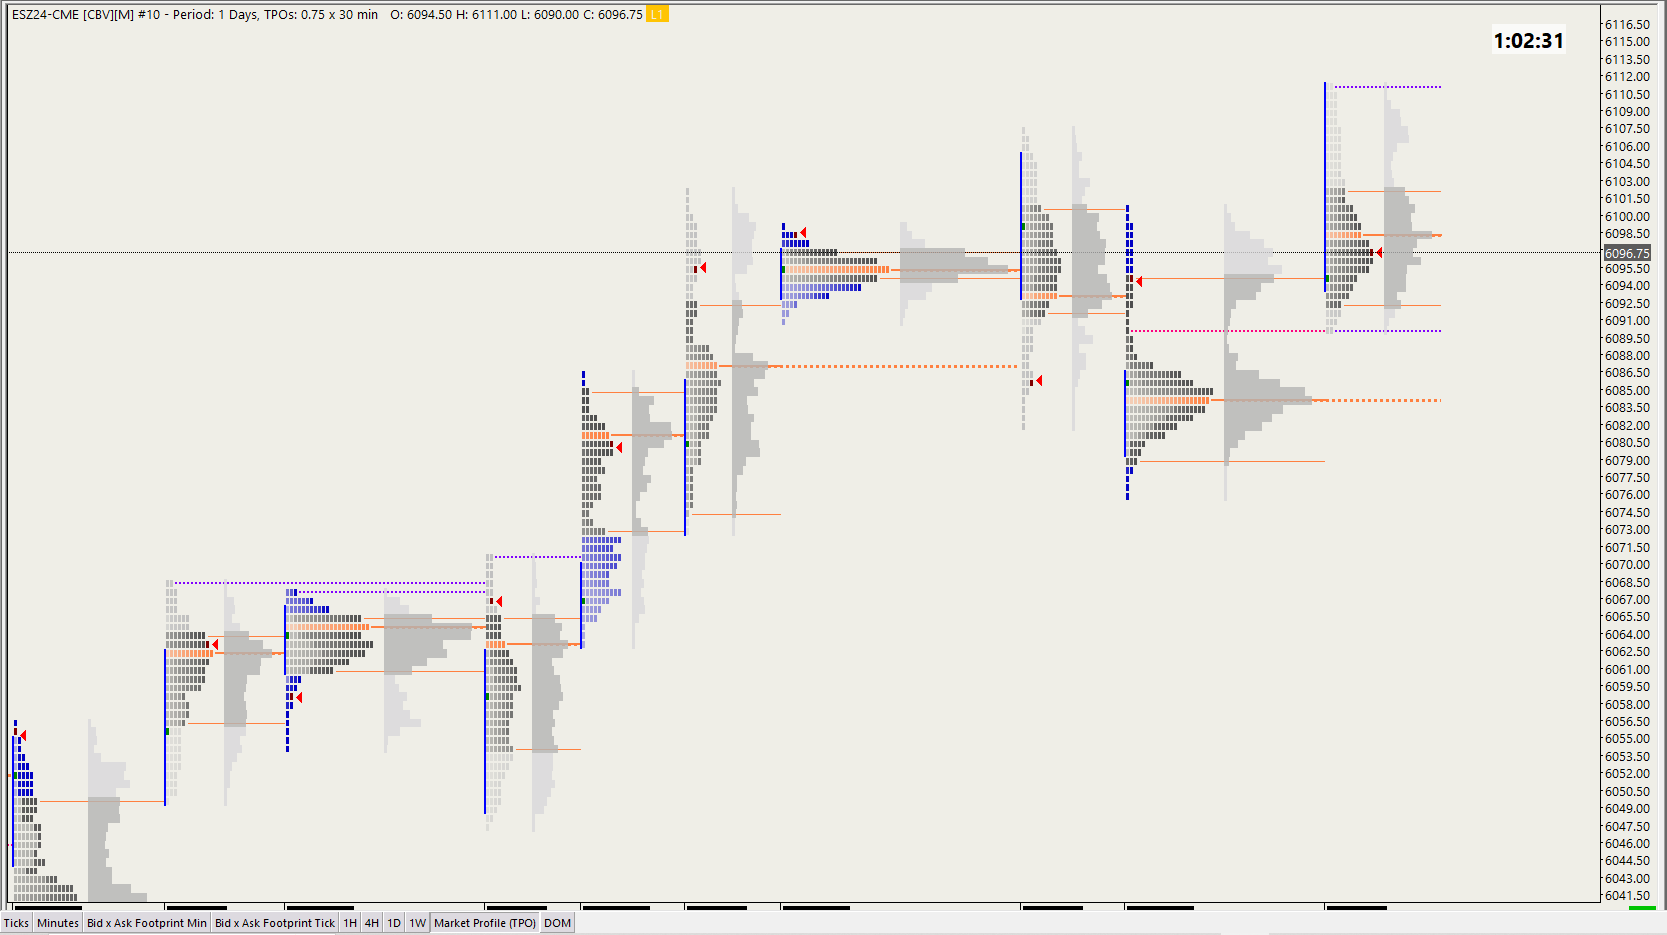
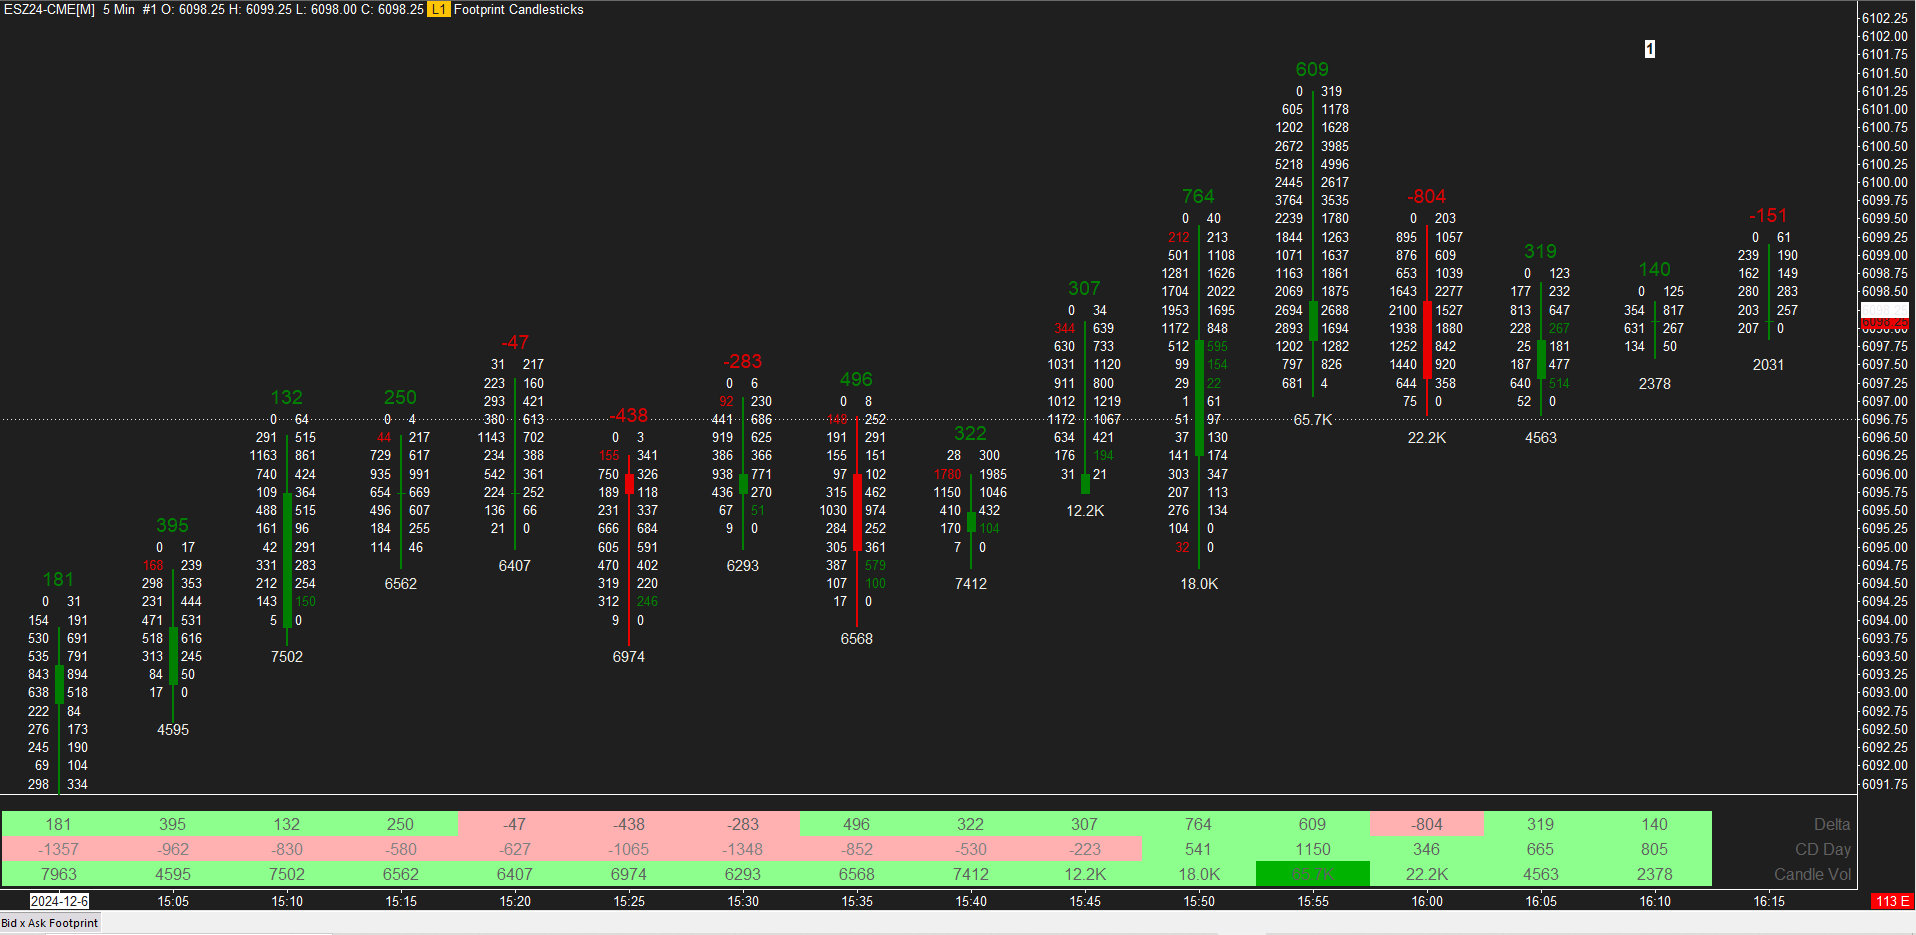
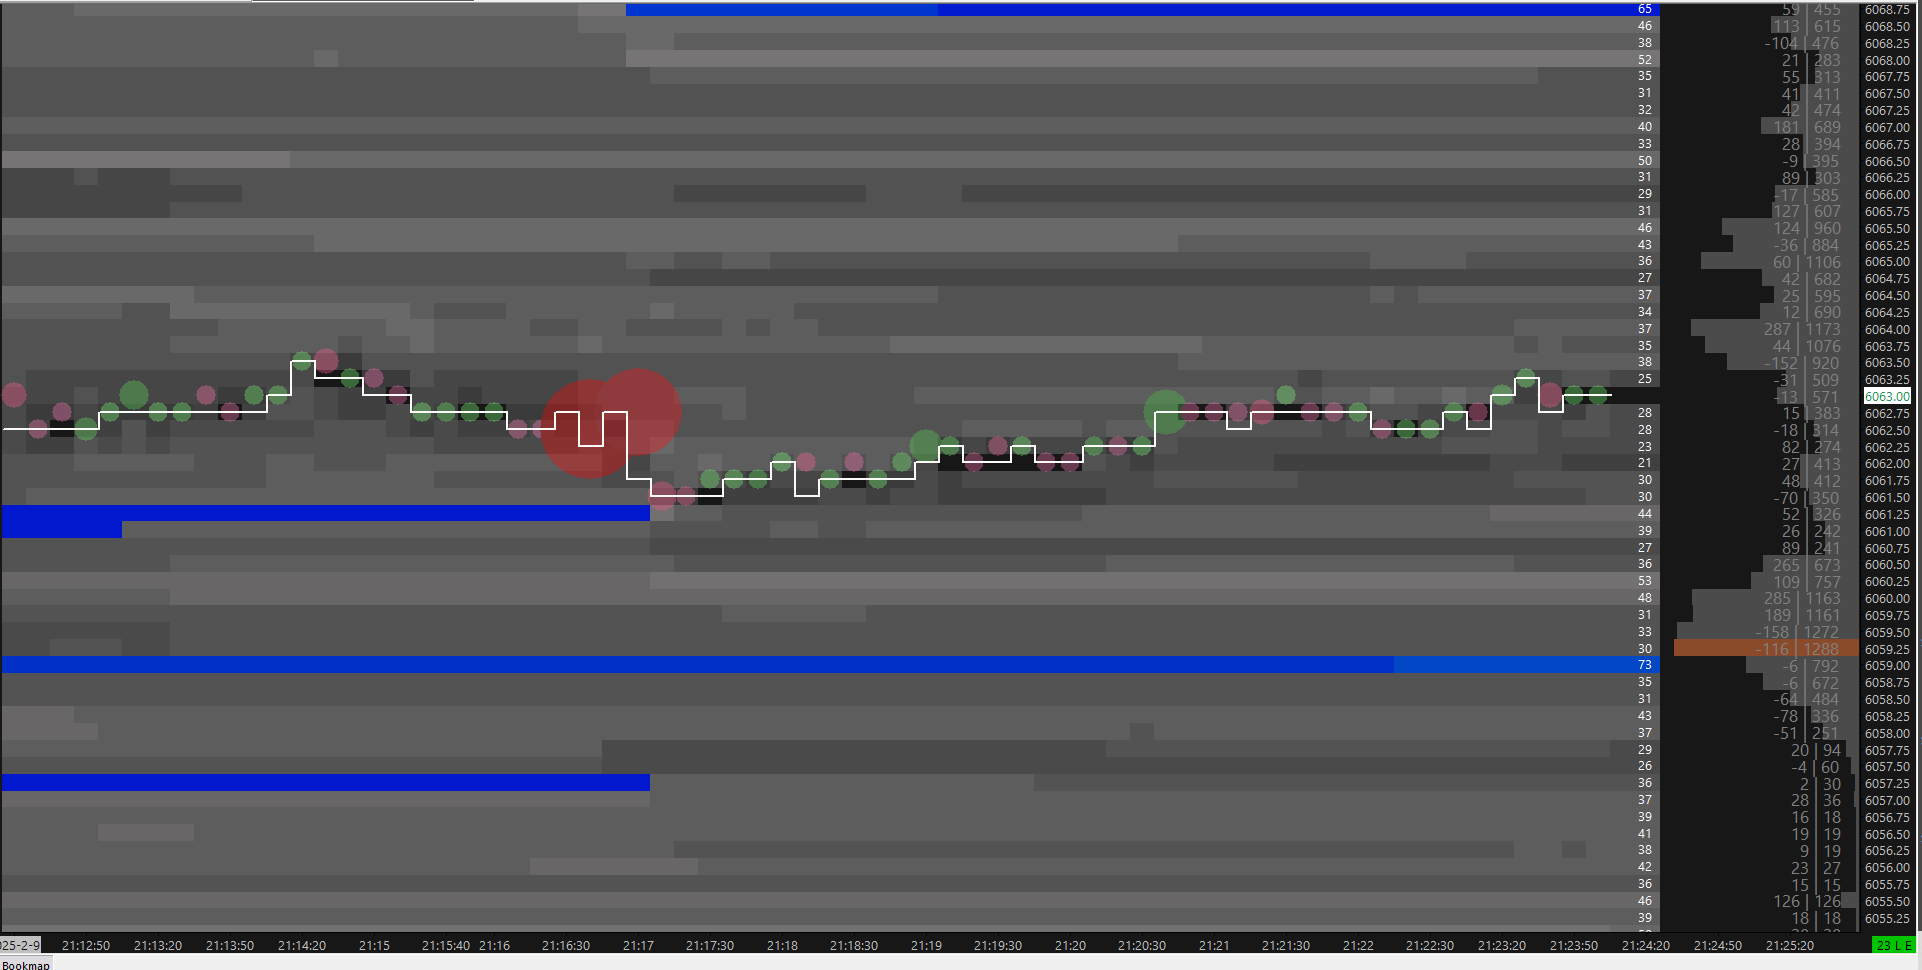
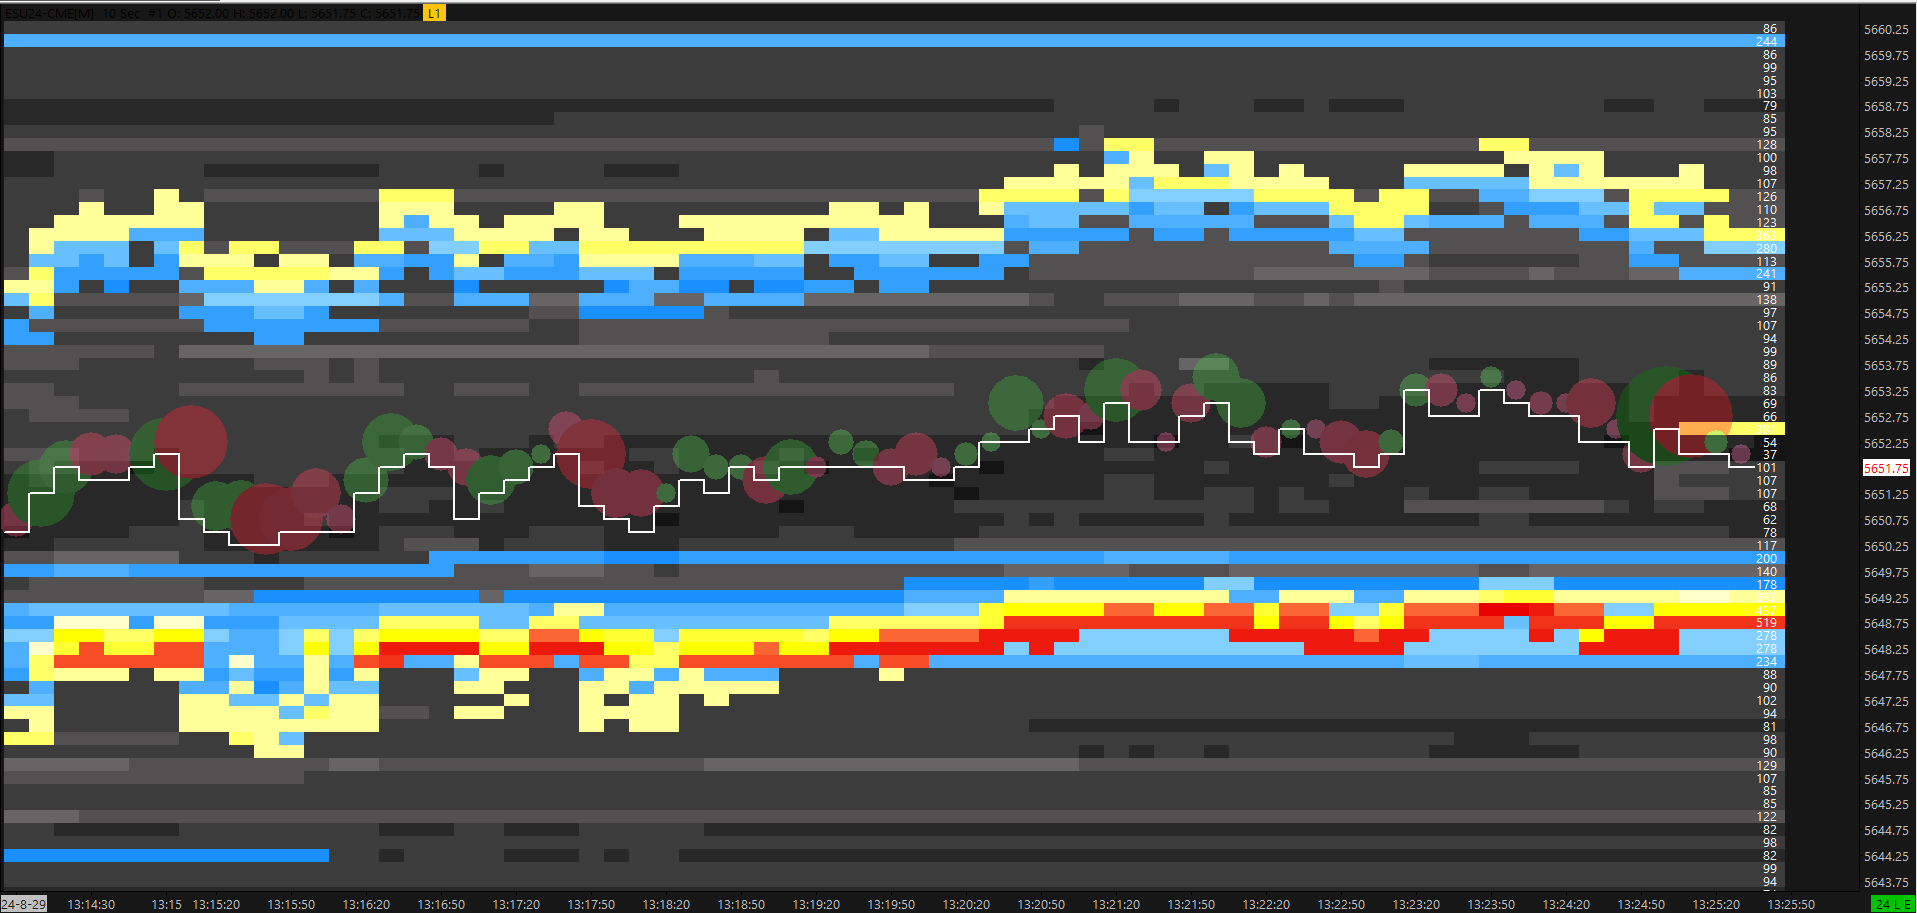
Base 5: delayed CME data, advanced volume profile studies, market depth, TPO charts, footprint, etc
Integrated Package 10: live CME data capability, basic volume profile studies
Integrated Package 11: live CME data capability, advanced volume profile studies, market depth, TPO charts, footprint, etc
Integrated Package 12: this package is the same as 11, but also has additional Market by Order (MBO) functionality in the DOM.
I personally use package 11 and is what I recommend to everyone that want to get the most out of my chartbooks and do live trading. Whether using a real live account or using a prop funding company with Rithmic data.
In this video guide I show you how to manage your .cht Sierra Chart files after downloading and install them in your computer. Also I explain 3 ways to reboot your charts if the contracts are expired or there are other problems with charts not displaying properly.
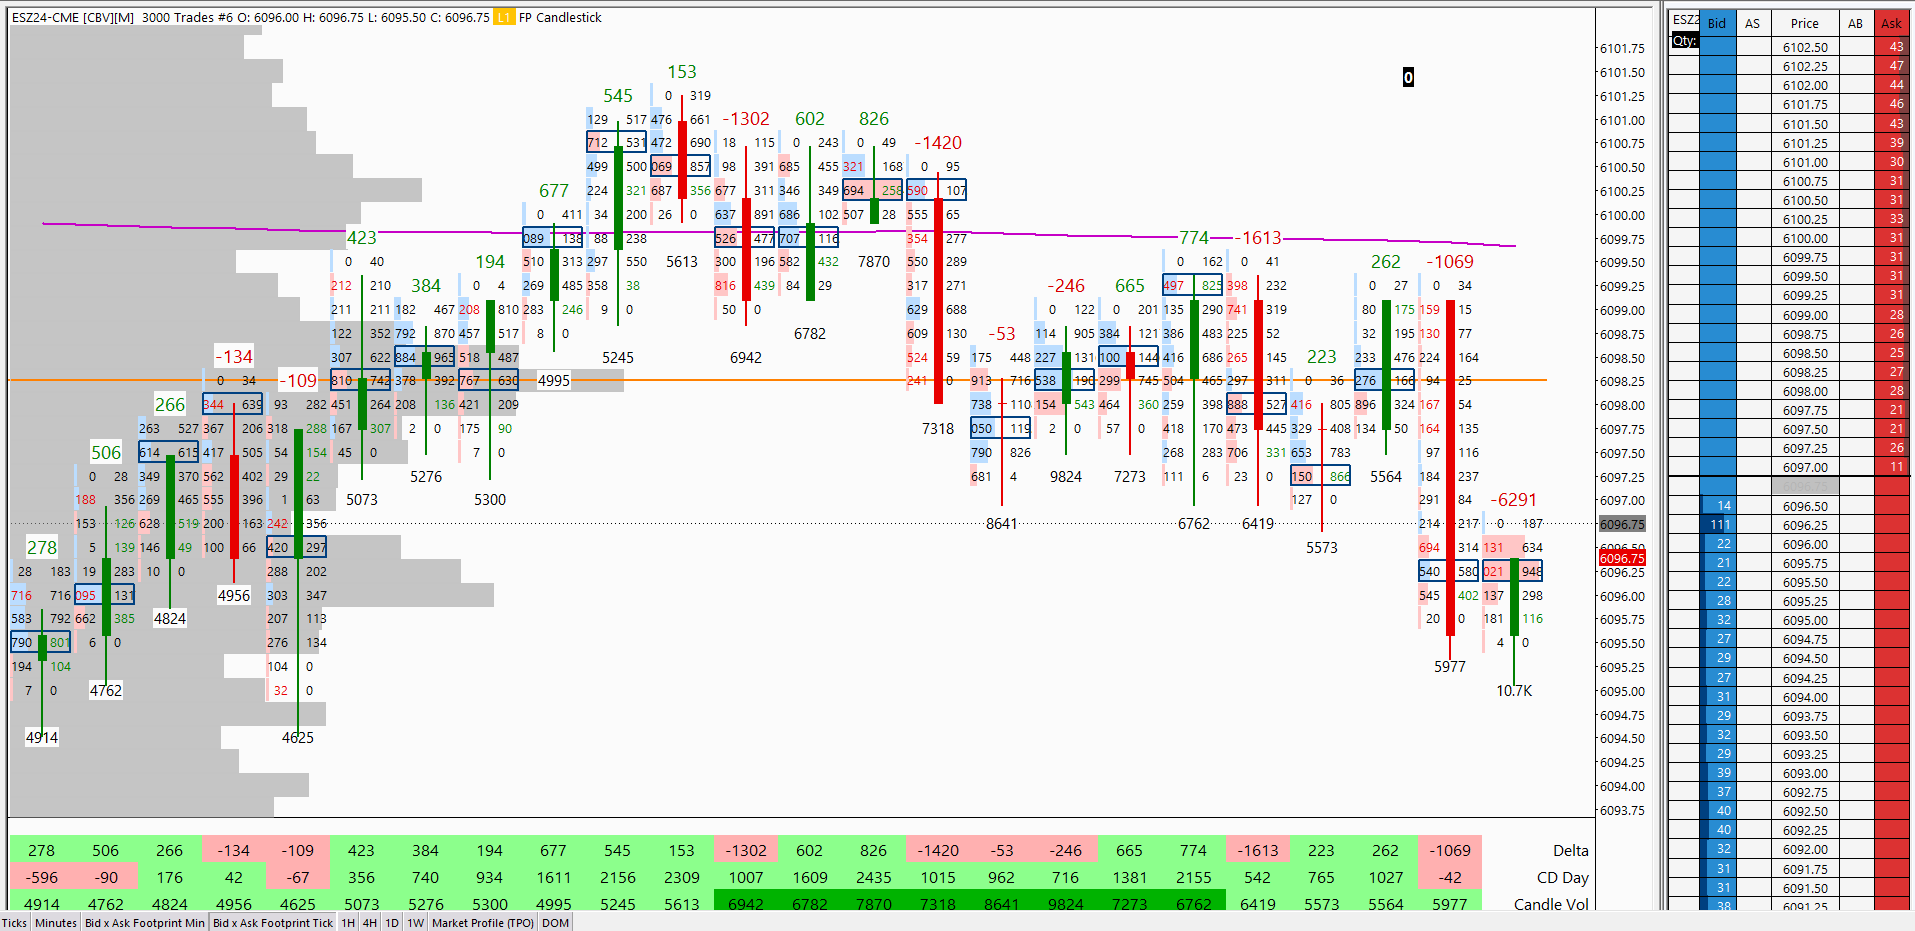
One of the most comm0on questions I get is how to adjust the font sizes on the Footprint / Numbers Bars Study. In this video I give a general guide to how you can change the font size, tick size foir a specific instrument and the zoom in/out features in order to get the footprint charts looking clear for whatever market you are using, but especially for ES/NQ on short term charts.