


Minute Candlestick Day Trading Setup
This is the setup that I use myself in my day trading charts for the futures markets using time based charts. I will generally look at a 5min or 1min chart. This template is set to a 5min chart of the June 2024 contract of ES (SP500) but you can easily customize it to other timeframes or markets.
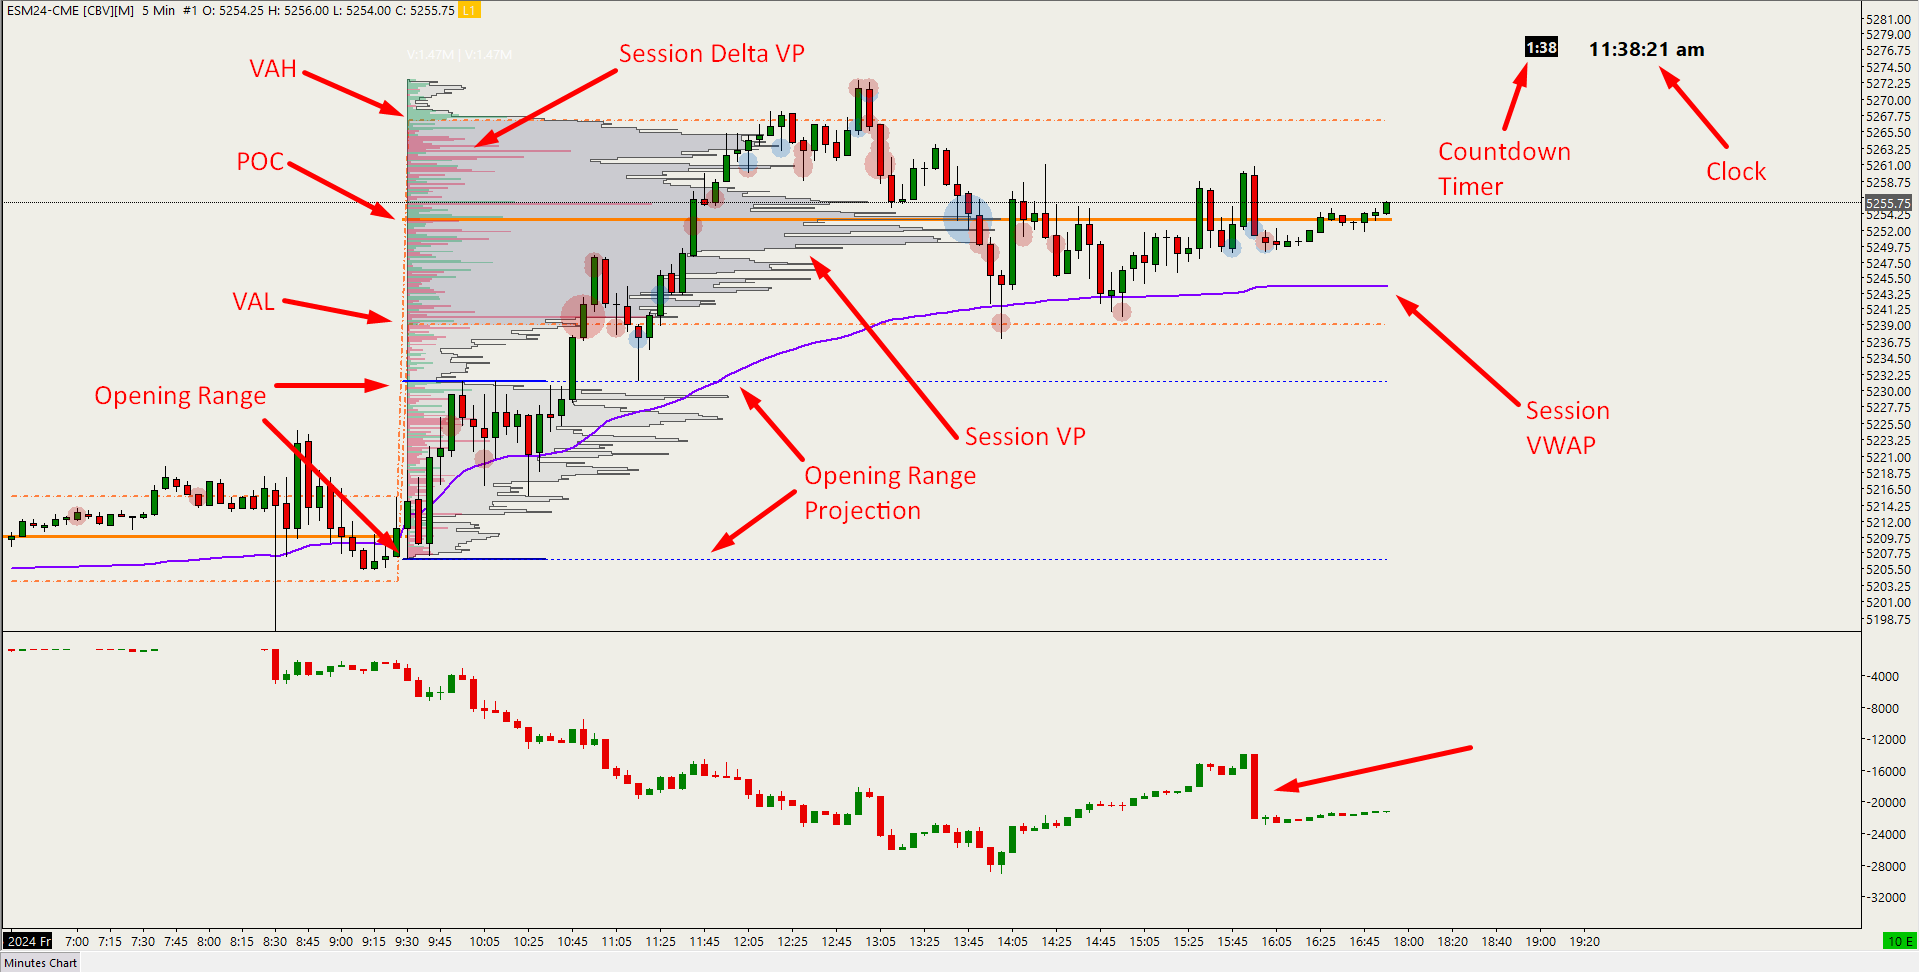
The elements on this chart consist of:
5min chart (this is what I use specifically for day trading ES (but you can easily change it in Chart, Settings, Bar Periods for other timeframes or other Symbols like NQ, Gold, etc)
Session VWAP (Volume Weighted Average Price)
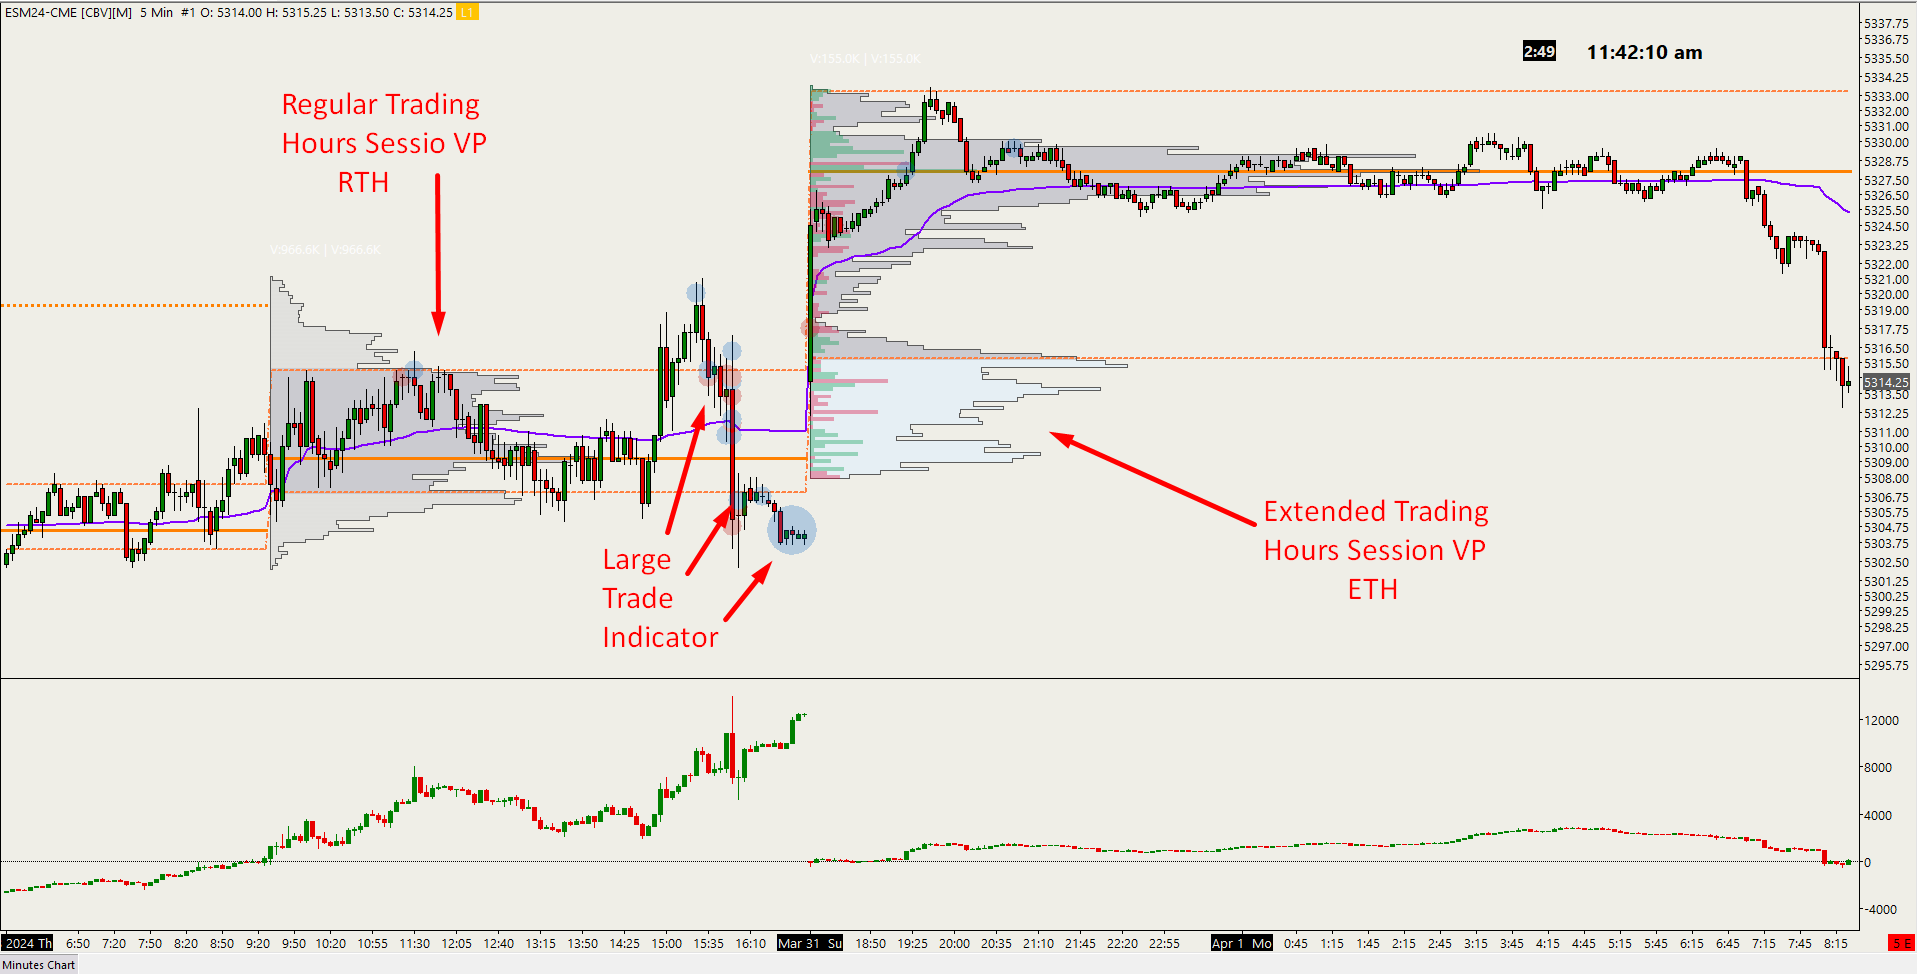
Session volume profile split for each session (grey for RTH, Blue for ETH) and all colors can be customized
Session delta volume profile to measure absorption of aggressive buyers/sellers
Current price line
Countdown timer until next candlestick starts forming
Clock
Large volume trade indicator (I have it set for 100 contracts) which can be changed to any number you want depending on markets or time of day
CVD - Cumulative Volume Delta below main chart to measure aggressive buyer/seller executions
Initial Balance for RTH marker (Solid blue lines) from 9:30am EST-10:30am EST
Initial Balance (IB) extension lines (dotted blue lines) for the rest of the current RTH session
The color/font settings I have on the screenshots are based on my own systems settings I have. When you load it on yours it may seem different based on your system, but all colors/text can be customized under the global graphic settings or if you prefer under individual Chart Graphic Settings.
This is the setup that I use myself in my day trading charts for the futures markets using time based charts. I will generally look at a 5min or 1min chart. This template is set to a 5min chart of the June 2024 contract of ES (SP500) but you can easily customize it to other timeframes or markets.
The elements on this chart consist of:
5min chart (this is what I use specifically for day trading ES (but you can easily change it in Chart, Settings, Bar Periods for other timeframes or other Symbols like NQ, Gold, etc)
Session VWAP (Volume Weighted Average Price)
Session volume profile split for each session (grey for RTH, Blue for ETH) and all colors can be customized
Session delta volume profile to measure absorption of aggressive buyers/sellers
Current price line
Countdown timer until next candlestick starts forming
Clock
Large volume trade indicator (I have it set for 100 contracts) which can be changed to any number you want depending on markets or time of day
CVD - Cumulative Volume Delta below main chart to measure aggressive buyer/seller executions
Initial Balance for RTH marker (Solid blue lines) from 9:30am EST-10:30am EST
Initial Balance (IB) extension lines (dotted blue lines) for the rest of the current RTH session
The color/font settings I have on the screenshots are based on my own systems settings I have. When you load it on yours it may seem different based on your system, but all colors/text can be customized under the global graphic settings or if you prefer under individual Chart Graphic Settings.