


Complete Day Trading 10 Chart Setup Dark Theme (Price Action, Volume Profile and Orderflow)
This complete chart dark theme combo consists of all the different charts and tools I use in my own day trading of futures markets. It is a simpler version of the Sierra Chart template that I share exclusively with my trading course students. All the Price Action, Volume Profile and Orderflow tools I always use are represented here. Everything has been meticulously organized and designed for the best charting and trading experience. This chartbook file is set to the September 2024 contract of ES (SP500) but you can easily change it to whatever market and session/s hours you want. Just go to chart settings, symbol and select NQ, Gold, or whatever other market you want and you can easily customize it to fit your trading needs.
This combo consists of 10 charts under a single chartbook file. Here is a breakdown of each chart you get, plus all the indicators/studies applied to them which you can see in the screenshots:
Ticks Chart: sessions volume profiles, session delta volume profile, session iceberg profile (right side), session VWAP, Large Trade Indicator, Clock, Candle Countdown, Cumulative Volume Delta
Minutes Chart: sessions volume profiles, session delta volume profile, session iceberg profile (right side), session VWAP, Large Trade Indicator, Clock, Candle Countdown, Cumulative Volume Delta
Bid x Ask Minute Footprint: session volume profile, session VWAP, delta size background highlight, candle countdown, candle POC marker, data numbers at bottom, candlestick overlay on footprint, delta & volume overlays
Bid x Ask Tick Footprint: session volume profile, session VWAP, delta size background highlight, candle countdown, candle POC marker, data numbers at bottom, candlestick overlay on footprint, delta & volume overlays
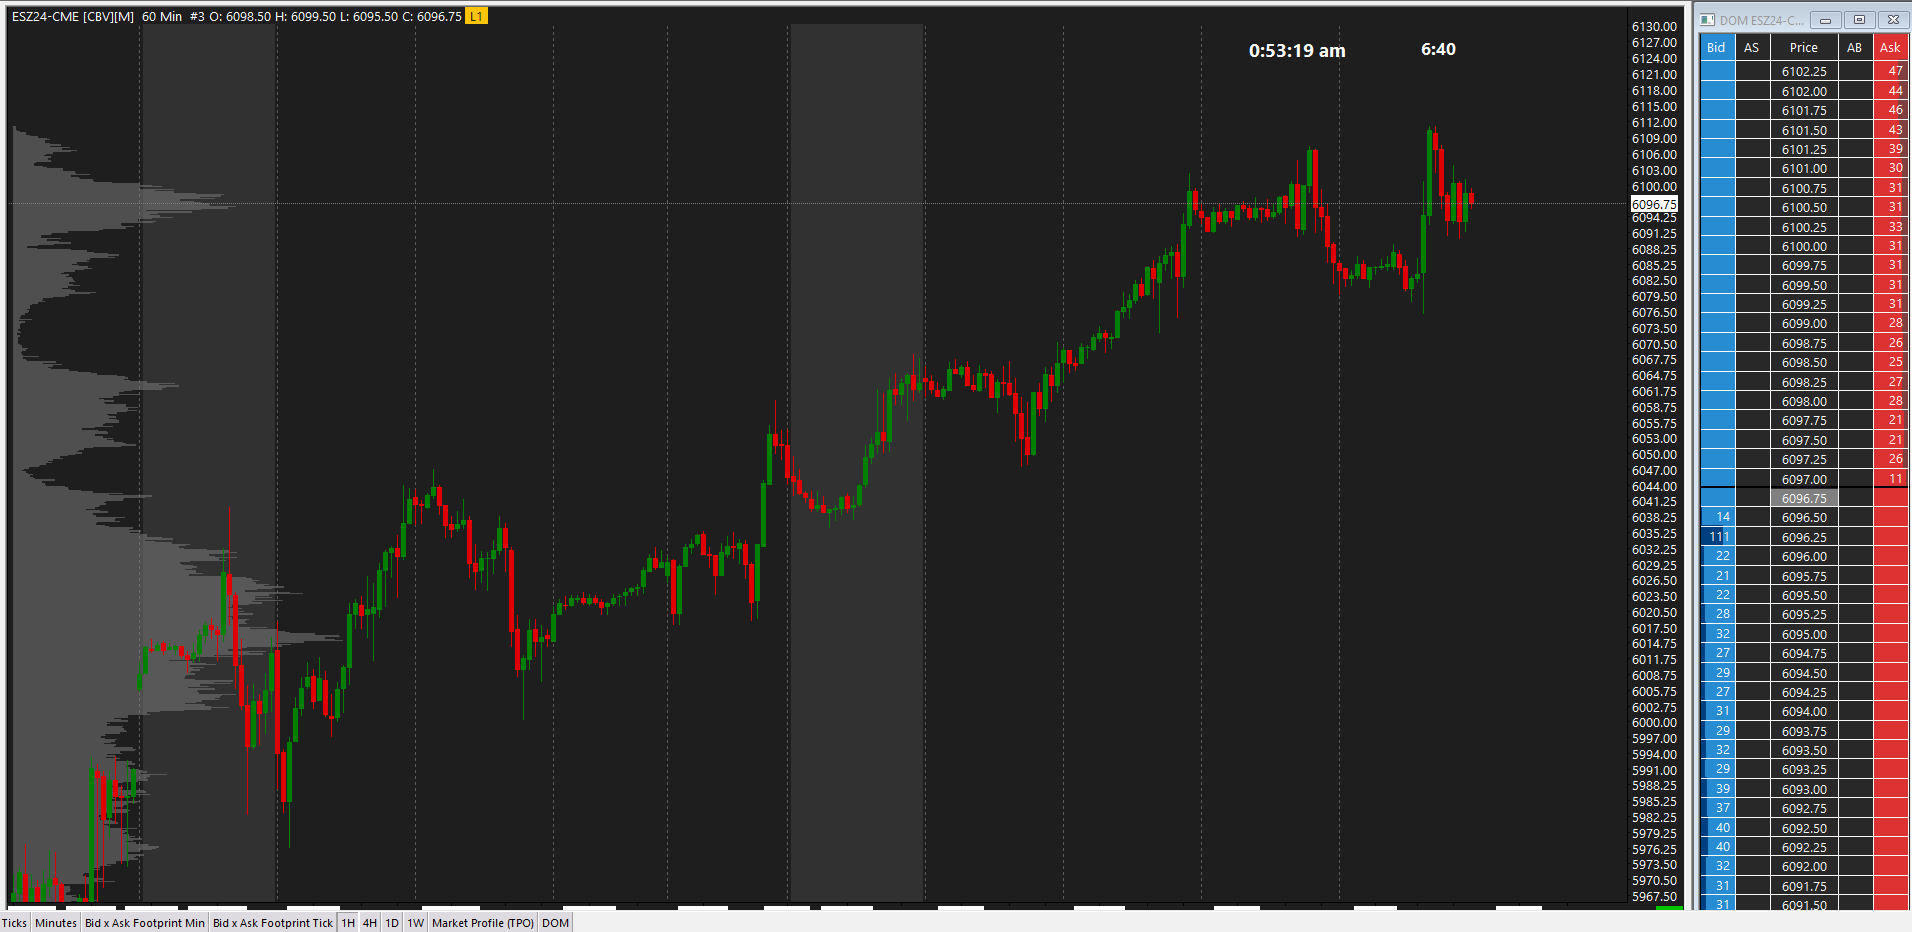
1 Hour Chart: session dividers, Monday background highlight, candle countdown, clock, long term volume profile
4 Hour Chart: session dividers, Monday background highlight, candle countdown, clock, long term volume profile
Daily Chart: long term volume profile, 20-50-200 simple moving averages
Weekly Chart: long term volume profile
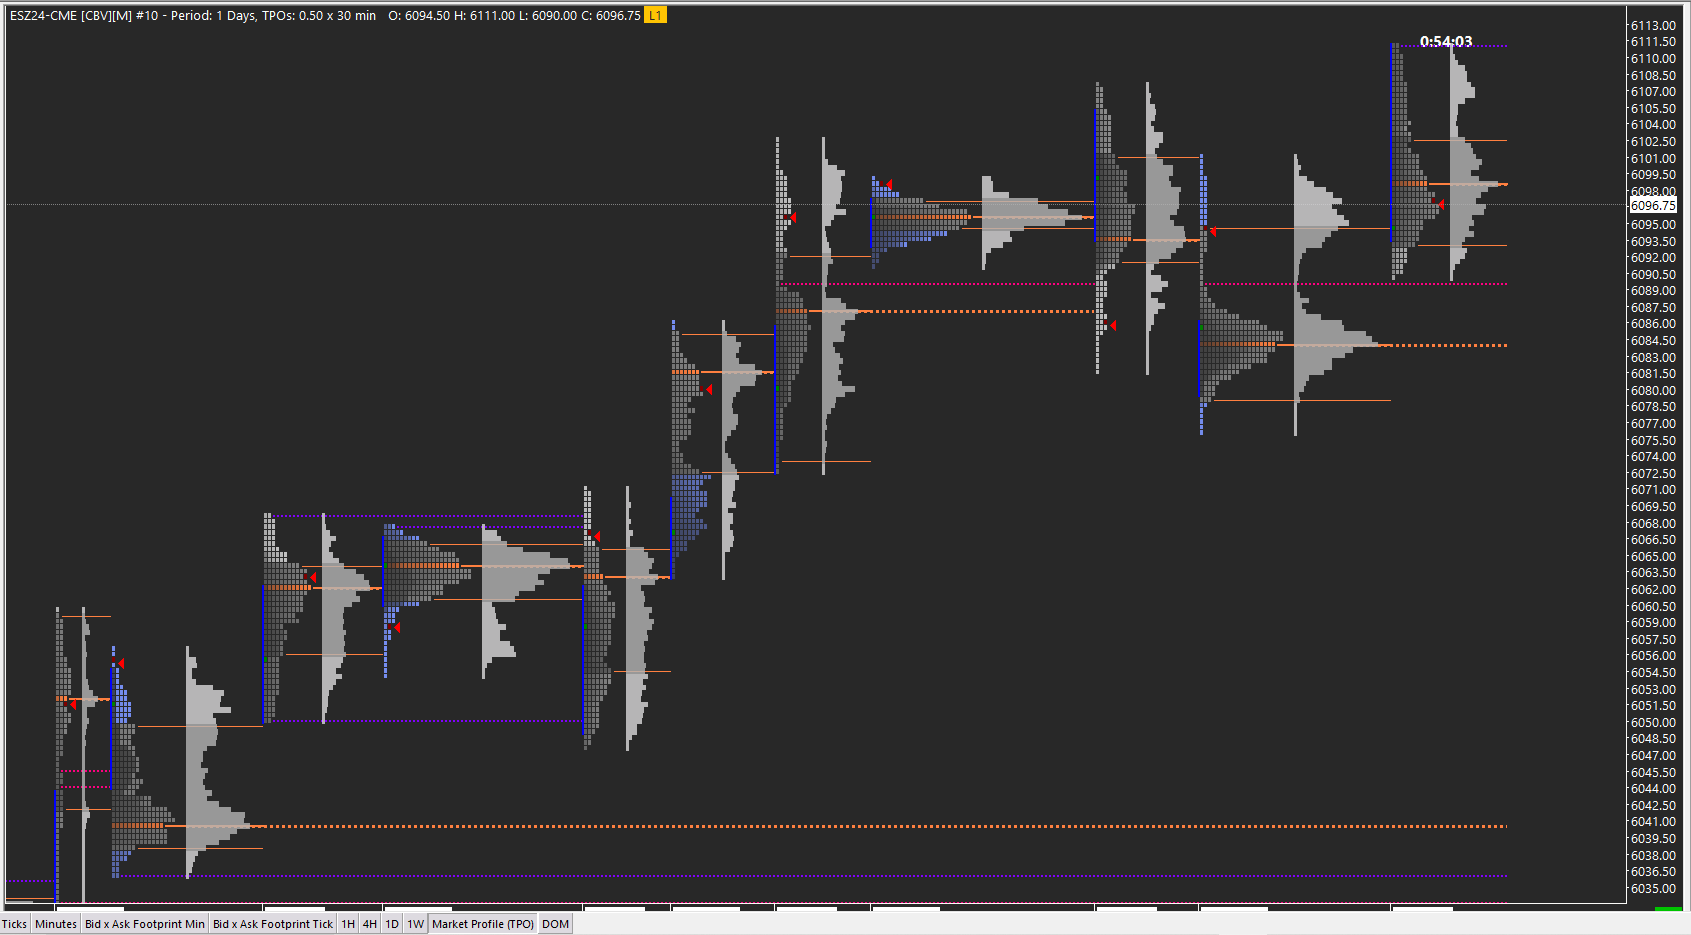
Market Profile (TPO) Chart: split between ETH and RTH sessions (can easily be made single daily session), clock, volume profiles, value area and POC markers, poor high/low markers with extensions, singles markers with extensions , naked POC extensions
DOM: you have a 5 column DOM with price, bids, asks, recent bids and recent asks orders displayed. This can be customized to add more data or to simplify it if needed. Also a low/high of day marker.
The color/font settings I have on the screenshots are based on my own systems settings I have. When you load it on yours it may seem different based on your system, but all colors/text can be customized under the Global Graphic settings or if you prefer separate color palettes under individual Chart Graphic Settings.
This complete chart dark theme combo consists of all the different charts and tools I use in my own day trading of futures markets. It is a simpler version of the Sierra Chart template that I share exclusively with my trading course students. All the Price Action, Volume Profile and Orderflow tools I always use are represented here. Everything has been meticulously organized and designed for the best charting and trading experience. This chartbook file is set to the September 2024 contract of ES (SP500) but you can easily change it to whatever market and session/s hours you want. Just go to chart settings, symbol and select NQ, Gold, or whatever other market you want and you can easily customize it to fit your trading needs.
This combo consists of 10 charts under a single chartbook file. Here is a breakdown of each chart you get, plus all the indicators/studies applied to them which you can see in the screenshots:
Ticks Chart: sessions volume profiles, session delta volume profile, session iceberg profile (right side), session VWAP, Large Trade Indicator, Clock, Candle Countdown, Cumulative Volume Delta
Minutes Chart: sessions volume profiles, session delta volume profile, session iceberg profile (right side), session VWAP, Large Trade Indicator, Clock, Candle Countdown, Cumulative Volume Delta
Bid x Ask Minute Footprint: session volume profile, session VWAP, delta size background highlight, candle countdown, candle POC marker, data numbers at bottom, candlestick overlay on footprint, delta & volume overlays
Bid x Ask Tick Footprint: session volume profile, session VWAP, delta size background highlight, candle countdown, candle POC marker, data numbers at bottom, candlestick overlay on footprint, delta & volume overlays
1 Hour Chart: session dividers, Monday background highlight, candle countdown, clock, long term volume profile
4 Hour Chart: session dividers, Monday background highlight, candle countdown, clock, long term volume profile
Daily Chart: long term volume profile, 20-50-200 simple moving averages
Weekly Chart: long term volume profile
Market Profile (TPO) Chart: split between ETH and RTH sessions (can easily be made single daily session), clock, volume profiles, value area and POC markers, poor high/low markers with extensions, singles markers with extensions , naked POC extensions
DOM: you have a 5 column DOM with price, bids, asks, recent bids and recent asks orders displayed. This can be customized to add more data or to simplify it if needed. Also a low/high of day marker.
The color/font settings I have on the screenshots are based on my own systems settings I have. When you load it on yours it may seem different based on your system, but all colors/text can be customized under the Global Graphic settings or if you prefer separate color palettes under individual Chart Graphic Settings.