
 Image 1 of 2
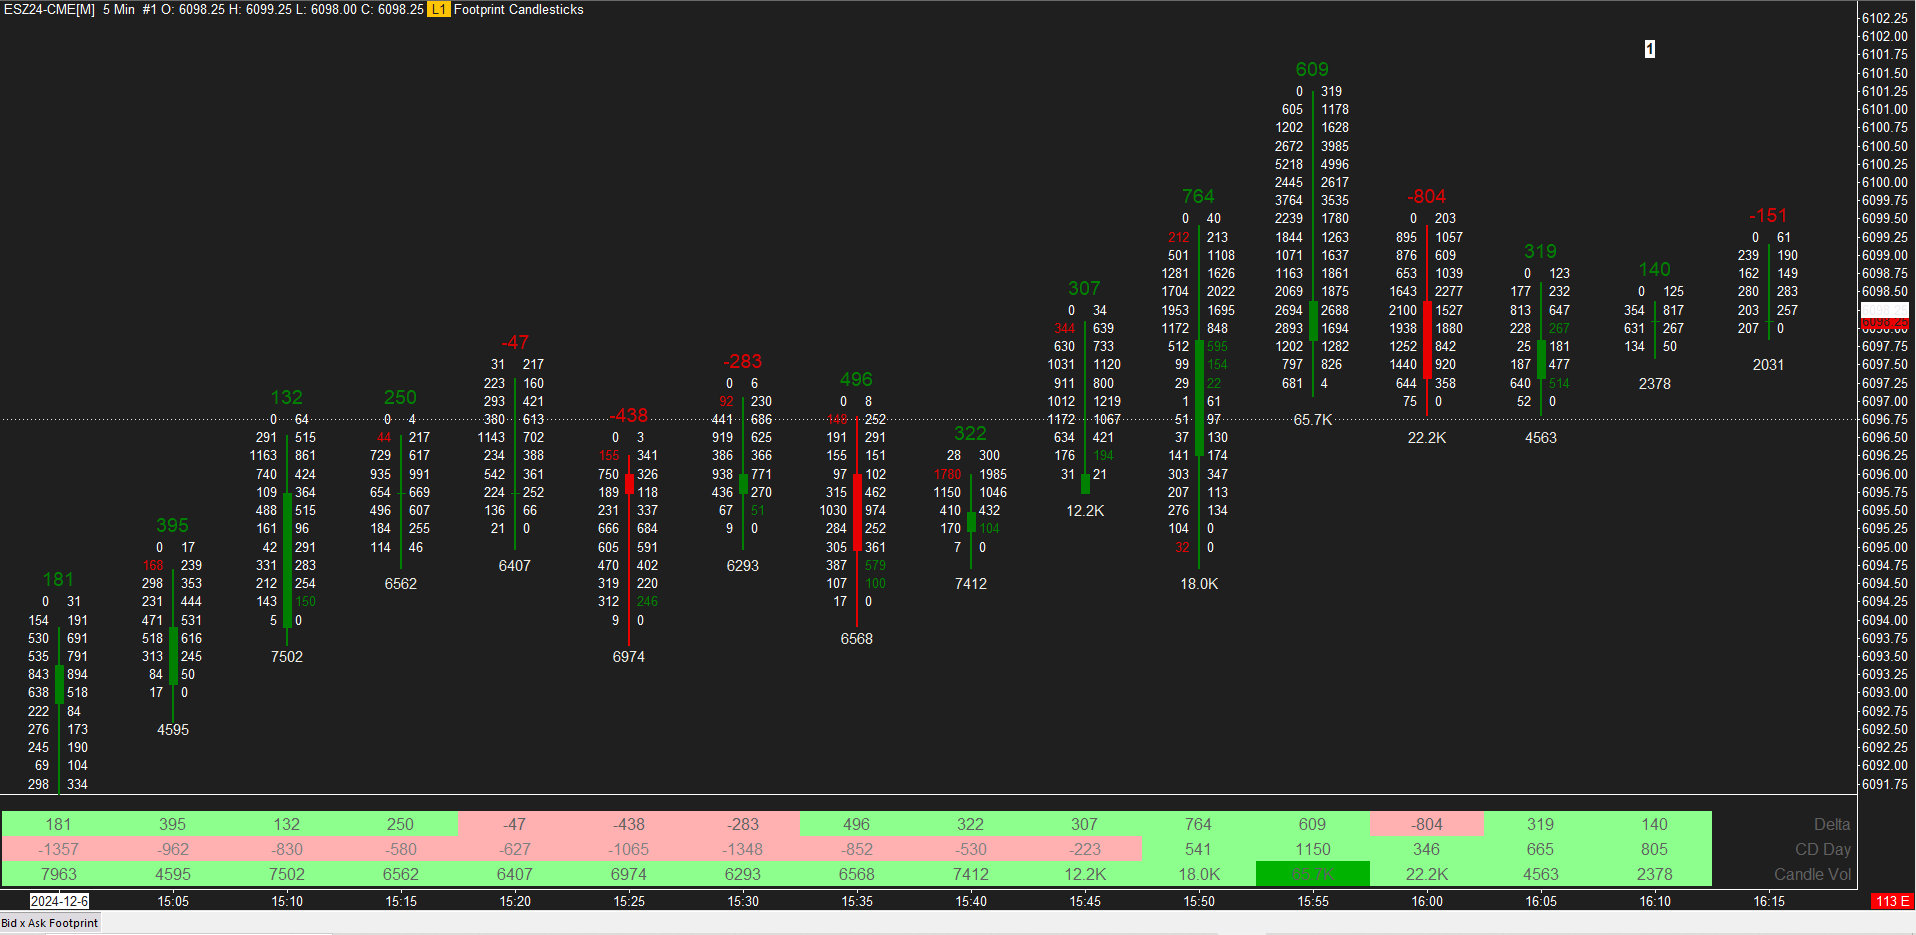
 Image 2 of 2
This is a dark theme Footprint Chart set as Bid x Ask with a candlestick insert, featuring the following indicators and settings:
300%+ Imbalances highlighted in Red/Green
Delta, Daily Cumulative Delta and Volume data on bottom (more categories can be easily enabled)
Current Price Line
Countdown Timer
Delta & Volume Overlays
This chart is set for 3000 tick candles in the ES/SP500 futures market on the March 2026 contract, but it can easily be changed to any instrument and timeframe/data periods you may want.
Also with footprint charts, make sure you familiarize yourself with the “Lock Fill Space” setting under the Chart menu. This will lock the chart at a specific point so it doesn’t keep printing candlesticks that go outside of the screen, but auto adjusts to always show the latest candle on the screen.